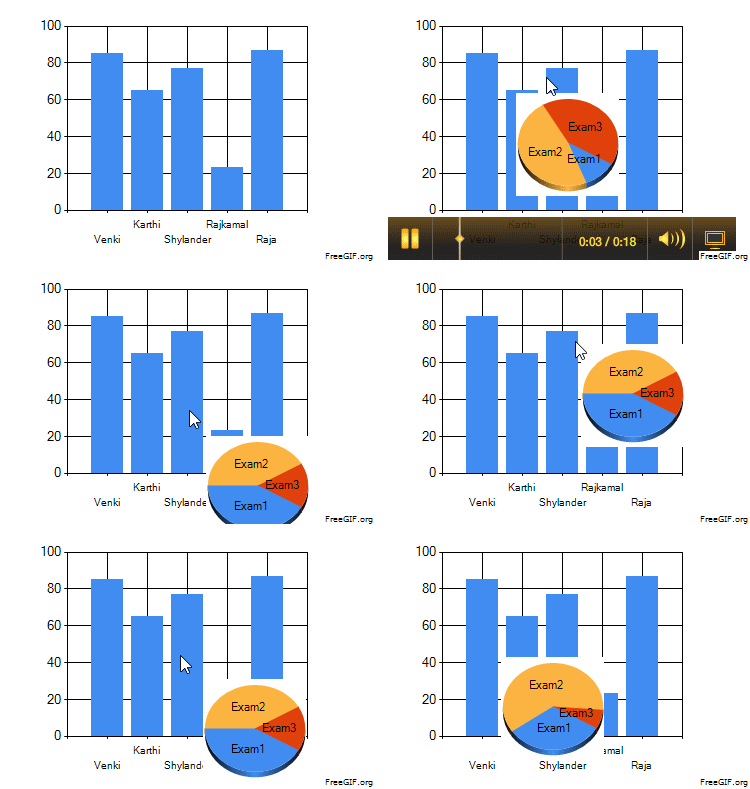
Steps to follow :
- Create two tables in Database and Fill data to it.In second table Add multiple records for Single name that has been in First table.
- Create the chart in page1.aspx, keep that chart in the div tag.
- Create other Chart in same page place it in the other div tag and make it as invisible.
- Create the new page as page2.aspx and remove all the coding except page directory.
- Write the script in page1.aspx to show tool tip.
Database Structure
Table 1
Table 2
<%@ Register Assembly="System.Web.DataVisualization, Version=4.0.0.0, Culture=neutral, PublicKeyToken=31bf3856ad364e35"
Namespace="System.Web.UI.DataVisualization.Charting"
TagPrefix="asp"
%>
<!DOCTYPE html>
<html>
<head runat="server">
<title>Fourthbottle</title>
<script type="text/javascript" src="http://ajax.aspnetcdn.com/ajax/jQuery/jquery-1.9.0.min.js"></script>
<script type="text/javascript" src="http://ajax.aspnetcdn.com/ajax/jquery.ui/1.10.0/jquery-ui.min.js"></script>
<script type="text/javascript">
$(document).ready(function () {
$("#mainchart").mouseleave(function () {
ToolTipFading()
$("#FADINGTOOLTIP").hide();
});
$("#mainchart").mouseenter(function () {
ToolTipFading()
$("#FADINGTOOLTIP").show();
});
});
var wnd_height,
wnd_width;
var
tooltip_height, tooltip_width;
var
tooltip_shown = false;
var transparency
= 100;
var masleft = 0;
var mastop = 0;
var timer_id =
60;
function
DisplayTooltip(tooltip_url) {
var
FADINGTOOLTIP = document.getElementById("FADINGTOOLTIP");
FADINGTOOLTIP.innerHTML = '<IMG
SRC="' + tooltip_url + '"
TARGET=_blank>';
tooltip_shown = (tooltip_url != "")
? true : false;
if (tooltip_url
!= "") {
var posx = 0;
var posy = 0;
if (!e) var e = (window.event) ? event : ex;
if (e.pageX ||
e.pageY) {
posx = e.pageX;
posy = e.pageY;
FADINGTOOLTIP.style.visibility = "visible";
FADINGTOOLTIP.style.left = (posx ) + "px";
FADINGTOOLTIP.style.top = (posy ) + "px";
ToolTipFading()
}
ToolTipFading();
}
else {
FADINGTOOLTIP.style.visibility = "hidden";
}
}
function
ToolTipFading() {
var
FADINGTOOLTIP = document.getElementById("FADINGTOOLTIP");
if (transparency
<= 100) {
FADINGTOOLTIP.style.filter = "alpha(opacity="
+ transparency + ")";
FADINGTOOLTIP.style.opacity = transparency / 100;
transparency += 5;
timer_id = setTimeout('ToolTipFading()',
35);
}
}
</script>
</head>
<body>
<form id="form1" runat="server">
<div id="mainchart" style="width:250px; border-color:Red; border-width:2px;">
<asp:Chart ID="Chart1" runat="server"
Height="250px">
<Series>
<asp:Series ChartType="Column"
Name="Series1">
</asp:Series>
</Series>
<ChartAreas>
<asp:ChartArea Name="ChartArea1">
</asp:ChartArea>
</ChartAreas>
</asp:Chart>
</div>
<div id="FADINGTOOLTIP" style="position: absolute; visibility: hidden; background-color: transparent; height:250px;"
>
<asp:Chart ID="Chart3" runat="server"
Height="250px">
<Series>
<asp:Series Name="Series3"
ChartType="Pie">
</asp:Series>
</Series>
<ChartAreas>
<asp:ChartArea Name="ChartArea3">
</asp:ChartArea>
</ChartAreas>
</asp:Chart>
</div>
</form>
</body>
</html>
Page1.aspx.cs [C#] :
using System;
using System.Collections.Generic;
using System.Linq;
using System.Web;
using System.Web.UI;
using System.Web.UI.WebControls;
using System.Data;
using System.Data.SqlClient;
using System.Drawing;
using System.Net;
namespace ChartOverChart
{
public partial class pge1 : System.Web.UI.Page
{
protected void Page_Load(object sender, EventArgs e)
{
SqlConnection con = new SqlConnection("your connection string");
con.Open();
SqlDataAdapter da = new SqlDataAdapter("select * from table1", con);
DataSet ds = new DataSet();
da.Fill(ds);
Chart1.DataSource = ds;
DataTable Table = new DataTable();
Table = ds.Tables[0];
Chart1.BorderSkin.BackColor = Color.Transparent;
for (int i = 0; i < Table.Rows.Count;
i++)
{
Chart1.Series["Series1"].Points.AddXY(Table.Rows[i]["Name"], Table.Rows[i]["Attendance"]);
Chart1.Series["Series1"].MapAreaAttributes = "onmouseover=\"DisplayTooltip('page2.aspx?Point=#VALX');\"";
}
}
}
}
Page2.aspx
Note : No HTML control should be used in this page. your overal page should be with page directory and Directory for Charts and asp chart as shown below.
( Whole coding should be like below. )
<%@ Page Language="C#" AutoEventWireup="true" CodeBehind="page2.aspx.cs" Inherits="ChartOverChart.page2" %>
<%@ Register Namespace="System.Web.UI.WebControls" TagPrefix="asp" %>
<asp:chart id="popchart" BackColor="Transparent" runat="server" Width="110px" height="110px" RenderType="BinaryStreaming">
<Series>
<asp:Series Name="series2" ChartType="Pie">
</asp:Series>
</Series>
<ChartAreas>
<asp:ChartArea Area3DStyle-Enable3D="true" Name="ChartArea2">
</asp:ChartArea>
</ChartAreas>
</asp:chart>
Page2.aspx.cs [ C# ]
using System;
using
System.Collections.Generic;
using
System.Linq;
using
System.Web;
using
System.Web.UI;
using
System.Web.UI.WebControls;
using
System.Data;
using
System.Data.SqlClient;
using
System.Drawing;
namespace
ChartOverChart
{
public partial class page2 : System.Web.UI.Page
{
protected void Page_Load(object
sender, EventArgs e)
{
string Qs =
Request.QueryString["Point"].ToString();
SqlConnection
con = new SqlConnection("your connection string");
con.Open();
SqlDataAdapter
da = new SqlDataAdapter("select * from table2 where Name='"+Qs+"' ", con);
DataSet ds = new DataSet();
da.Fill(ds);
popchart.DataSource = ds;
DataTable
Table = new DataTable();
popchart.BackColor = Color.Transparent;
Table = ds.Tables[0];
for (int i = 0; i < Table.Rows.Count; i++)
{
popchart.Series["series2"].Points.AddXY(Table.Rows[i]["Exam"], Table.Rows[i]["Percenatge"]);
}
}
}
}
web.config file : Add the below code to your web.config file under <system.web> section.
<system.web>
<httpHandlers>
<add path="ChartImg.axd" verb="GET,HEAD,POST"type="System.Web.UI.DataVisualization.Charting.ChartHttpHandler,
System.Web.DataVisualization, Version=4.0.0.0, Culture=neutral,
PublicKeyToken=31bf3856ad364e35" validate="false" />
</httpHandlers>
<pages>
<controls>
<add tagPrefix="asp" namespace="System.Web.UI.DataVisualization.Charting"assembly="System.Web.DataVisualization,
Version=4.0.0.0, Culture=neutral, PublicKeyToken=31bf3856ad364e35" />
</controls>
</pages>
<compilation debug="true" targetFramework="4.0">
<assemblies>
<add assembly="System.Web.DataVisualization,
Version=4.0.0.0, Culture=neutral, PublicKeyToken=31BF3856AD364E35" />
</assemblies>
</compilation>
. .
. . . . .
.
. . . . . .
</system.web>


